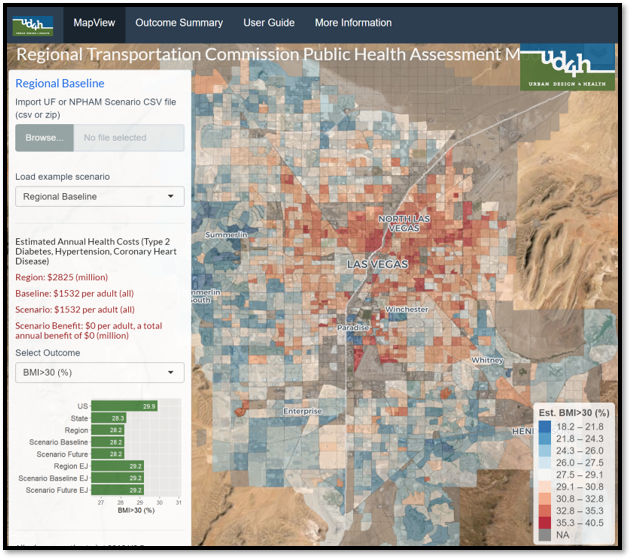
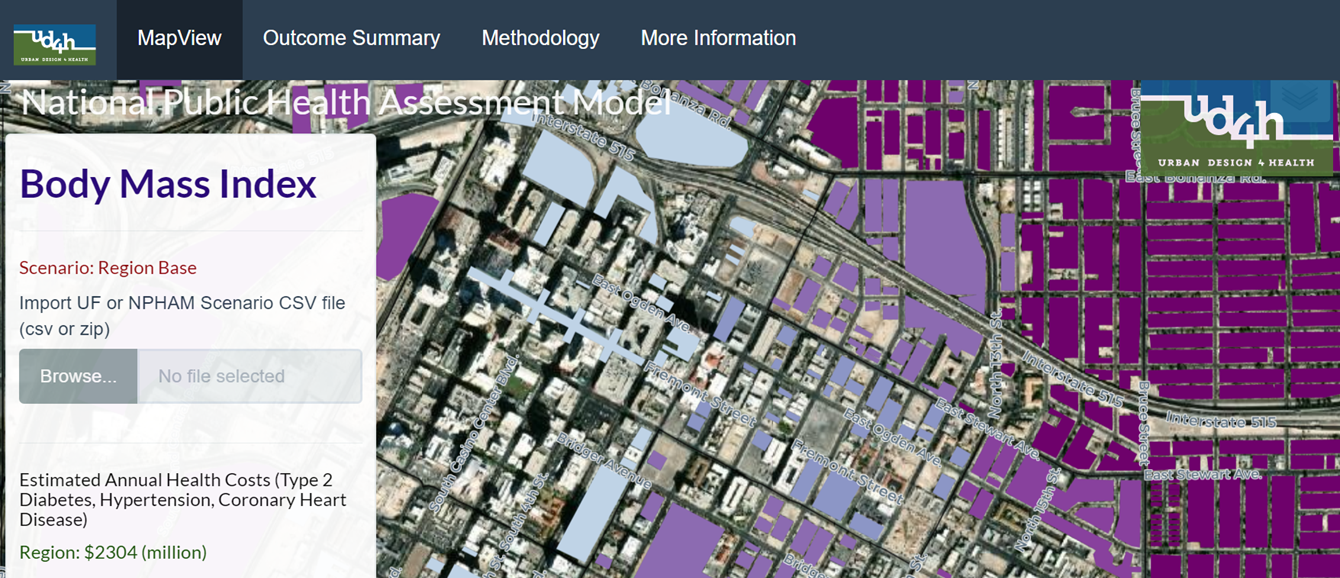
N-PHAM uses evidence-based statistical models from large sample health and activity surveys to estimate chronic disease prevalence and physical activity at small scale geographies. N-PHAM is intended for use by public agencies to integrate community health considerations into their transportation, land use, and community design decisions.
 This web-based tool can evaluate existing and future conditions to support all levels of community planning, including project siting, comprehensive planning, project prioritization, aspirations planning, and equity analysis. N-PHAM can be combined with other datasets such as air pollution exposure, climate change resiliency, and economic vitality to provide evidence informed decision support for evaluating current conditions and future change scenarios.
N-PHAM’s integration of demographic and built environment factors allows estimates to be stratified by socioeconomic class and location. The tool also offers a suite of cross-sectional statistical models that estimate current and future community health and transport-related physical activity levels for states, counties, regions, cities, census tracts, or census block groups. The models rely on an extensive set of independent variables that describe demographic and built/natural environmental conditions. UD4H developed N-PHAM with partial support from the US Environmental Protection Agency’s National Health and Environmental Effects Research Lab.
Click here to explore NPHAM for the Washington DC (MWCOG) region.
Click here to explore NPHAM for the San Diego (SANDAG) region.

US Census Block Group, Traffic Analysis Zone, or custom:

US Census Block Group:
US Census block group and larger geographies or custom:
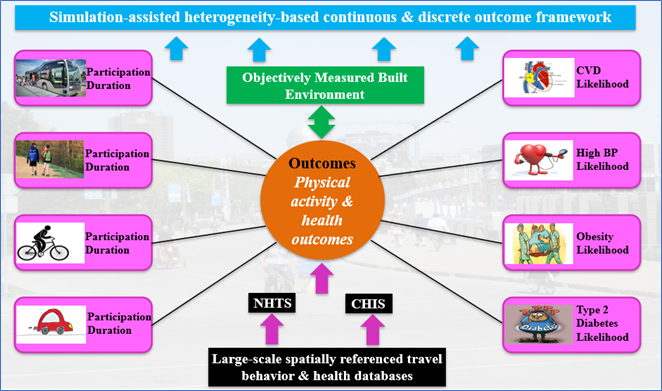
Health outcomes are modeled using logistic or linear regression from a cross-sectional survey of over 50,000 participants. Models are currently being updated using a simulation-assisted heterogeneity-based modeling framework, known as random-parameter (RP) models. This improved method addresses the heterogeneity prevalent in the complex relationships between our environment, our behavioral choices, and long-term health outcomes.

Southern California Council of Governments
The California Statewide Public Health Assessment Model (C-PHAM)San Joaquin Council of Governments
Health Impact Scenario Planning for RTP Development in StocktonGenessee Transportation Council:
Integration of Scenario Planning and Health ImpactsAir Alliance Houston (I-45):
Health Impact Assessment for the proposed I-45 North freeway re-alignment project
RTC of Southern Nevada:
Transportation and Health StudySacramento Area Council of Governments (in progress):
2024 Bluerint Health InicatorsAir Alliance Houston (2045 LRTP) (in progress):
tools and data to quantify health, equity, and related economic impacts of proposed transportation investments: 2045 LRTP Evaluation and Future BRT Evaluation (Health and PM2.5 Exposure)
RTC of Southern Nevada (in progress):